Big data and data analysis in a spectacular and user-friendly way


Spicy Analytics
HTTPS://SPICYANALYTICS.COM/UX/UI design, Web application design
Big data, healthcare
2019


The basic problems and solutions
Analytics, big data-based applications are becoming more common due to the amazing amounts of data already available in all industries. In connection with these, the problem often arises that without expert analysis, instead of a solution, only an opaque, incomprehensible data set is given to the user, in the rarest of cases in a user-friendly form. Our goal was to change this lineup, so we undertook to commission SPICY ANALYTICS to create a product turnover forecasting system, PLAN@CLOUD.
Plan@Cloud provides reliable, credible statistical forecasts of changes in distribution for products and product groups. This primarily helps the work of pharmaceutical business decision-makers and managers in the field of inventory management and production optimization. The methodology and the algorithms based on it were developed by Spicy's staff - big-data - price statisticians - based on a professionally accepted methodology. The system is thus able to make forecasts without human intervention and present them in a way that is understandable and understandable to ordinary users. The service can be easily accessed and used online from any computer as a web application.
During the implementation of a solution that is unique in the market internationally, we followed three main aspects:
- It should also be applicable and understandable to business users without statistical qualifications, without expert assistance
- It must be accessible from any machine without any special technical requirements
- Creating a more exciting, modern interface that elevates the often monotonous work of users working with larger data sets and forecasts.

The service
The English language service of Plan@Cloud has been optimized for the operational processes of the international pharmaceutical industry. Registered users can use it as a trial for free for 30 days, after which Spicy Analytics will create a personalized offer for them.
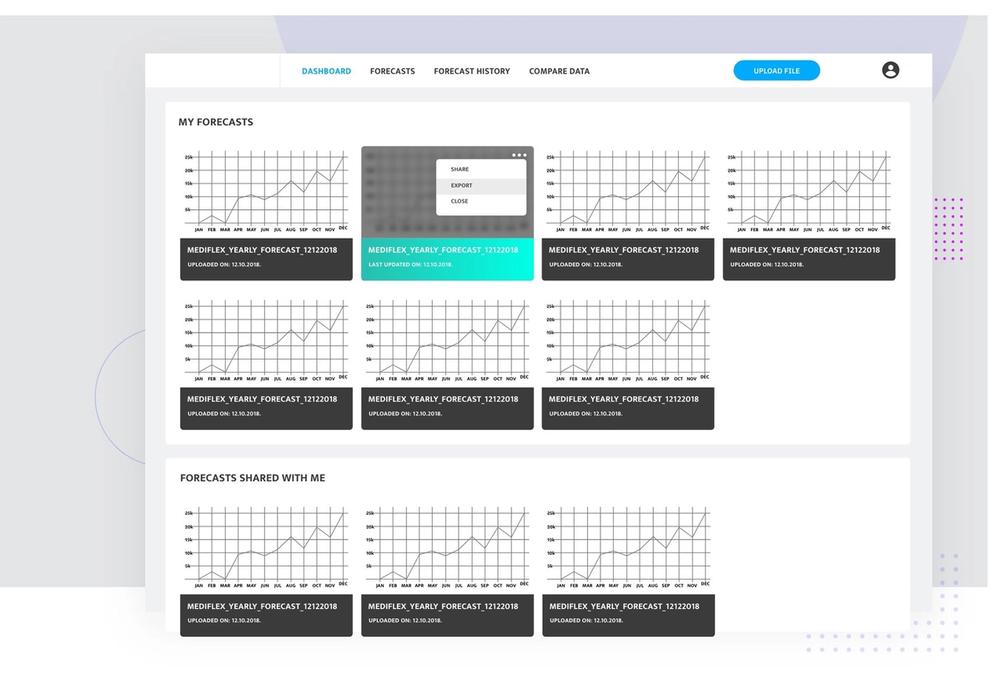
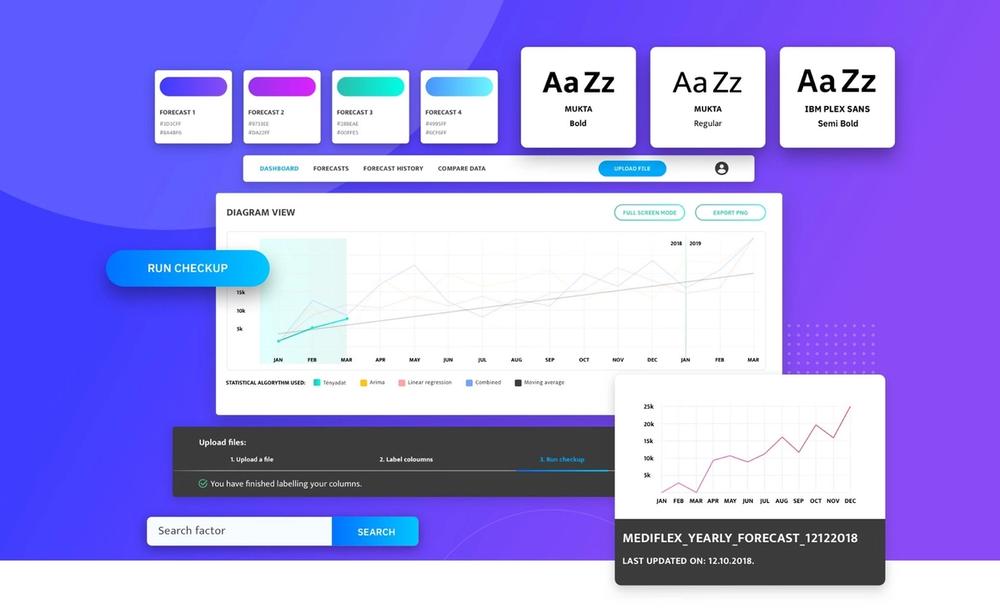
Product traffic data sets can be uploaded by users to the web interface. The program validates the uploaded data, filters out erroneous data and offers the possibility of correction. After that, the characteristics of each data set must be set, and then the prediction is completed. The results are presented in graphical form, broken down by month, and can also be downloaded in XLS format.
The interface can archive already closed forecasts, which are comparable to other archived or currently running forecasts. All data can be stored, filtered, shared, viewed in list and chart views. Employees working on the same project / workplace can create user groups, and users with admin rights can also modify their profiles and permissions.
Technology background
The web backend uses the Laravel framework, and is is based on the REST API architecture, and the Couchbase database manages the data. Laravel is excellent for developing such complex applications, the structure of REST effectively supports the form of communication between the frontend and the backend.
The Forecast backend works through Python and Couchbase - Couchbase was used to process a lot of data at the request of the customer.
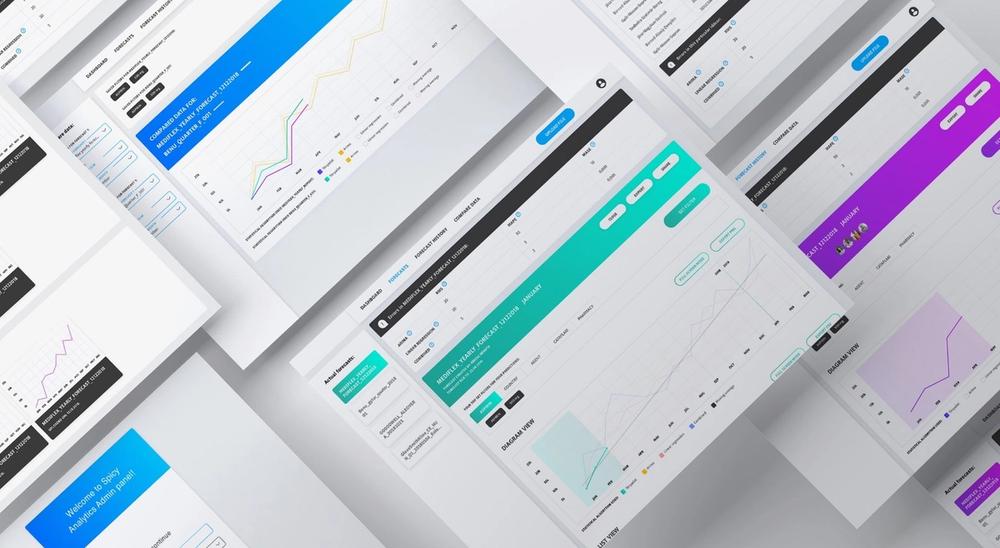
For the frontend in the React framework, the Cheppers UX team dreamed up a beautiful chart to represent complex and huge data sets. Implementation required much closer-than-usual collaboration between the UX / UI and frontend teams, as the available open source chart modules often provided quite a bit of leeway for both developers and designers. Our choice ultimately fell on a VICTORYCHART chart type developed by Formidable that is as customizable as possible and specifically well documented.

Challenges of the project work
Cheppers involved 6 developers (4 backends, 2 frontends), 2 UX / UI designers and 1 project manager in the design and implementation.
We also faced several new challenges, such as working with Couchbase for the first time. There were also extra demands compared to the available graphical solutions, and the graphs were finally designed accordingly.
At the end of the work process, we were able to deliver a stable, reliable, complex forecasting system that meets customer expectations and is unique in the industry internationally. Anyone can try and use the free trial now, we look forward to your feedback!
Share
Similar projects


We migrated Budapest's well-known Artmozi cinema network's Drupal 7 site to Drupal 8, while we also managed to improve the usability a lot.


To serve unexpected visitor peaks and ever-changing datasets, the Cheppers team created a backend solution.