Google map with labelled markers


One of our clients required an image of a map for print. As will be seen on the map, there will be marked places that represent where the company performed surveys. The goal of this blogpost was to present the evolution of a task like we described above. Although the Google Map developer documentation is very useful we had to read many forums and other blogs where we found the desired solution.


One of our clients required an image of a map for print. As will be seen on the map, there will be marked places that represent where the company performed surveys. During data collection, we were unsure as to which datasets would be included in the finalized work. It was clear that we had to provide a dynamic solution. We used Google Maps API to create an image in document.
The goal of this blogpost was to present the evolution of a task like we described above. Unfortunately we didn’t find detailed and proper documentation to achieve our goal. Although the Google Map developer documentation is very useful we had to read many forums and other blogs where we found the desired solution. But those suggestions weren’t quite detailed and well-documentated than this blogpost wants to be. We’d like to help those whom want to use similar solution.
You can create a Google Map integration quickly and easily by using the Google Map developer documentation as well as countless other tutorials. The extra feature of this task was to use individual icons and labels for marker points. The starter code of the map is very simple: we need a map API js script calling which contains your individual API KEY in the head of HTML.
The next steps are to define a div element named “map” as well as defining the CSS rule for this map by setting the dimensions. To set the parameters of the map, (i.e. centre, zoom, etc), we must create an initialized script.
Since June 2018, we set up a valid billing account via Google Cloud platform Console in order to use Google MAP API.
<!DOCTYPE html><html lang="en"><head><meta charset="UTF-8"><title>Térkép</title><style>#map {height: 100%;width: 100%;}html, body {height: 100%;margin: 0;padding: 0;}</style><script src="https://maps.googleapis.com/maps/api/js?key=YOUR_API_KEY&v=3.exp" type="text/javascript"></script></head><body><div id="map"></div><script>function initMap() {var bp = {lat: 47.538736, lng: 19.04631};var map = new google.maps.Map(document.getElementById('map'), {zoom: 11,center: bp});}initMap();</script></body></html>
The code above will load a map at 100% the width and height of the user’s browser. Budapest will appear in the centre of the map by using the center property of Google Map object. Budapest is chosen as the map’s central point since it is the place where the client took the survey. Our map appears within the “map” identified div element.
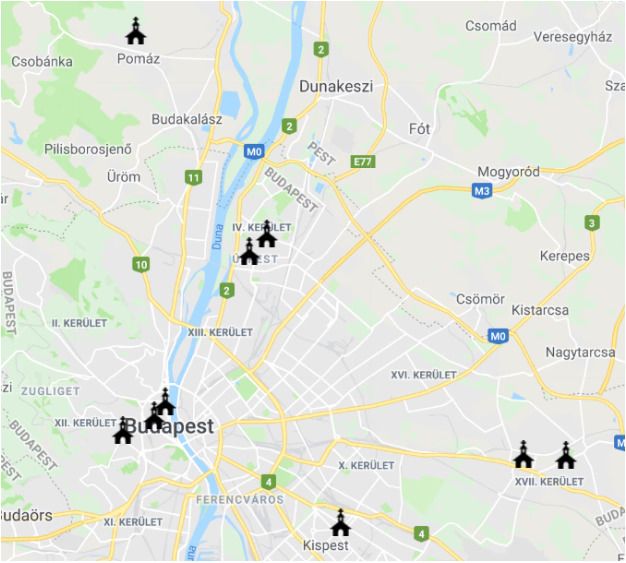
The next step is to add markers to the map where the measurements were done. As data was still being collected, we wanted to create an easy to modify, flexible data-structure that can be simply extendable or changeable. We also wanted to use custom markers as well as show the name of the points. In order to do this we defined an array named locations in Javascript inside the initMap() function. The first element of each item was to name the location, (we will use the first parameter as labels). After this, we defined X and Y coordinates, (i.e. latitude and longitude values). The arranged structure facilitates the transparency of data and the later enlargements.
After the above step, we uploaded a free image into a free image-hosting server. This was done because we wanted to load the image remotely, (and of course our client was able to check our progress from time-to-time). Then we iterate through the locations array and added Markers into the map by using coordinates. For ease of interpretation, we used an item variable inside the iteration for each items.
The position property of the Marker object needs both the latitude and longitude as object. The map parameter connects to the defined Google Map object, (i.e these are the two required parameters of a marker object). You can define a unique image as an icon by the icon attributes. The title option works as a classic HTML-title attributes.
var locations = [['Label 1', 47.453740, 19.142052],['Label 2', 47.502547, 19.038126],['Label 3', 47.650821, 19.020171],['Label 4', 47.490881, 19.012405],['Label 5', 47.562505, 19.087996],['Label 6', 47.481118, 19.250704],['Label 7', 47.569537, 19.098241],['Label 8', 47.496817, 19.030732],['Label 9', 47.480566, 19.276519]];var image = 'https://goo.gl/dqvvFA';for (var i = 0; i < locations.length; i++) {var item = locations[i];var marker = new google.maps.Marker({position: {lat: item[1], lng: item[2]},map: map,icon: image,title: item[0]});}
The result is good but it is not feasible for static images, (which we really need for the final result). The labels should be shown by default. The HTML title, (which is provided by the title parameter of Maps Marker), can’t help. So we started to examine the InfoWindow() object of Google Map. However, this was an aberration because it opened its box only by clicking on the marker.

The next step brought us closer to the desired goal. We can define a custom label to each marker by the label property of the Marker object. If the Marker has label attributes, we can use the icon to add other parameters for the labels. We can use the icon’s labelOrigin property which defines the offset of a label’s position in the map. The X and Y offsets work with integers and affects the position of the defined label.
So, we changed the iteration to the following:
for (var i = 0; i < locations.length; i++) {var item = locations[i];var marker = new google.maps.Marker({position: {lat: item[1], lng: item[2]},map: map,icon: {url: image,labelOrigin: { x: 12, y: -10}},title: item[0],label: {text: item[0],color: '#222222',fontSize: '12px'}});}
As seen in the code above, the icon received an object with two values, (url and labelOrigin), instead of a plain URL. The url parameter obtains the URL of the icon. Thanks to the labelOrigin, we can reposition our label according to the top-left corner of a loaded image. The label will be positioned along the x and y coordinate axis. We can either use the x and y values as mentioned above or use a new google.maps.point(12,-10) definition without using object. For labelOrigin. Both ways give the same result.
The additional, currently unused parameter options of icon are as follows:
- Anchor. The Anchor is the icon that can be repositioned from its center. The values are corresponding to the location of the marker, (i.e. on x:120 value the image will move left by 120px)
- Origin. The Origin appears in the icon’s position within the image as an offset. (This only makes sense if you are using an image from sprite image).
- Size. If using a sprite image, the size parameter is required. This parameter doesn’t resize our image. However, due to its size, it will reposition the icon.
- ScaledSize. ScaledSize is the actual size of our icon. After using this parameter, the image shown at the size we have defined, may be distorted.
The text parameter of the label property contains the printed label. The color parameter defines the color of the text. The fontSize determines the size of our label in pixels. Besides these, the label has additional options such as fontWeight, (i.e. the label in bold font), and fontFamily, (custom font families can be used). We didn’t want to use fontweight nor fontfamily for this project.


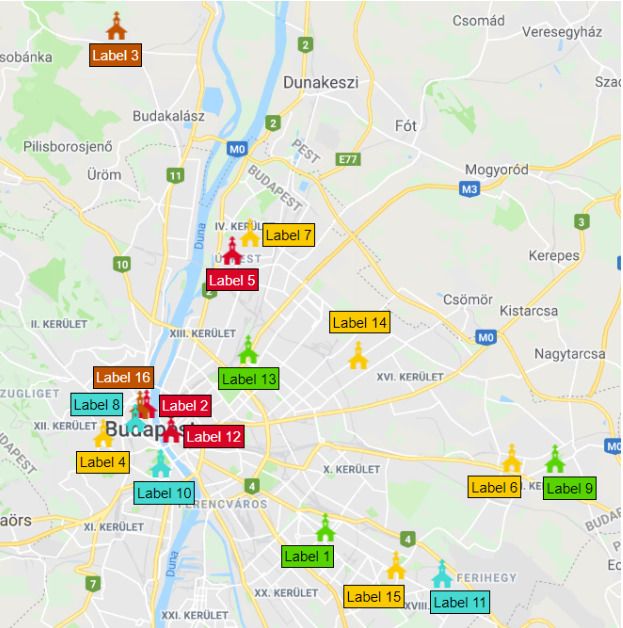
As you can see in the map above, the inscriptions are not clearly visible, particularly if they are overlapping each other. Due to this lack of visibility, we had to find a more effective solution for displaying labels. After many trial and errors, we found a super gmap extension library which we loaded for our project.
At this point of the process, our client asked whether locations can be categorized by different coloured icons, (since their work too is categorized by certain viewpoints). We re-structured the data in order to handle all requests and parameters, (such as titles, coloured labels, individual icons, position of labels and coordinates).
Each item in locations array contains 6 parameters instead of the original 3 options. The six parameters are as follows:
Title (will be used as label)X coordinate (latitude)Y coordinate (longitude)Color-codeX position of labelY position of label
The X and Y position labels represent the relative offset to the marker’s point with negative prefix. The -10 value in “X position of label” represents that the label will move to the right by 10px while 50 value in the “Y position of label” will move the label higher by 50px.
var locations = [['Label 1', 47.453740, 19.142052, 'green', 38, -3],['Label 2', 47.502547, 19.038126, 'red', -10, 20],['Label 3', 47.650821, 19.020171, 'brown', 23, -3],['Label 4', 47.490881, 19.012405, 'yellow', 23, -3],['Label 5', 47.562505, 19.087996, 'red', 23, -3],['Label 6', 47.481118, 19.250704, 'yellow', 37, -3],['Label 7', 47.569537, 19.098241, 'yellow', -10, 20],['Label 8', 47.496817, 19.030732, 'turquoise', 55, 33],['Label 9', 47.480566, 19.276519, 'green', 10, -3],['Label 10', 47.478538, 19.046445, 'turquoise', 23, -3],['Label 11', 47.435689, 19.210308, 'turquoise', 10, -3],['Label 12', 47.492465, 19.052041, 'red', -10, 15],['Label 13', 47.523764, 19.096748, 'green', 25, -3],['Label 14', 47.521279, 19.161779, 'yellow', 25, 50],['Label 15', 47.438614, 19.183433, 'yellow', 45, -5],['Label 16', 47.501973, 19.034013, 'brown', 40, 45]];
We created an array named icons for the different colors which contains the icon path URLs as well as the hexadecimal codes of the colors. We didn’t use hexadecimal code values in the production code because the view of the labels will be defined by the CSS classes.
Since we used the color-codes’ names as CSS classes, we had to update the stylesheet definitions.
The keys in the icons array are corresponding to the color-code of items in location array. The definition of icons array can be seen below:
var icons = {'green': {url: 'https://goo.gl/qvLZ4R',color: '#58D400'},'yellow': {url: 'https://goo.gl/G6HyHS',color: '#FCCA00'},'red': {url: 'https://goo.gl/6hkqX1',color: '#D80027'},'turquoise': {url: 'https://goo.gl/uLRpYZ',color: '#00D9D2'},'brown': {url: 'https://goo.gl/XTosFM',color: '#BF5300'}};
From hereon, we used the newly loaded MarkerWithLabel class instead of the Marker object provided by Google Map API. The position, map and the icon attributes are similar to the Marker’s attributes, however, the other parameters go through the properties of the new object.
The labelContent contains the text that will be displayed as title/label. The labelAnchor uses a Google Map Point object containing the offset of the label according to the marker’s position. This offset was starkly opposed to what we expected; the positive numbers shifted the labels left and downwards, while the negative numbers shifted the labels right and upwards. For the labelClass options, we defined CSS classes for the labels. By defining CSS classes for the labels, the label-boxes can be easily designed by stylesheets. The labelInBackground property allows labels to be placed in the background among layers.
for (var i = 0; i < locations.length; i++) {var item = locations[i];var marker = new MarkerWithLabel({position: {lat: item[1], lng: item[2]},map: map,icon: icons[item[3]].url,labelContent: item[0],labelAnchor: new google.maps.Point(item[4], item[5]),// the CSS class for the labellabelClass: "label " + item[3],labelInBackground: true});}
Our last task was to come up with a design solution that allows for the clear visibility of labels. The stylesheet definitions were extended in the head of the HTML in order to use the defined classes declared for labels.
.label {color: #000;background-color: white;border: 1px solid #000;font-family: "Lucida Grande", "Arial", sans-serif;font-size: 12px;text-align: center;white-space: nowrap;padding: 2px;}.label.green {background-color: #58D400;}.label.red {background-color: #D80027;color: #fff;}.label.yellow {background-color: #FCCA00;}.label.turquoise {background-color: #00D9D2;}.label.brown {background-color: #BF5300;color: #fff;}

Please see below the full source code:
<!DOCTYPE html><html lang="en"><head><meta charset="UTF-8"><title>Térkép</title><style>#map {height: 100%;width: 100%;}html, body {height: 100%;margin: 0;padding: 0;}.label {color: #000;background-color: white;border: 1px solid #000;font-family: "Lucida Grande", "Arial", sans-serif;font-size: 12px;text-align: center;white-space: nowrap;padding: 2px;}.label.green {background-color: #58D400;}.label.red {background-color: #D80027;color: #fff;}.label.yellow {background-color: #FCCA00;}.label.turquoise {background-color: #00D9D2;}.label.brown {background-color: #BF5300;color: #fff;}</style><script src="https://maps.googleapis.com/maps/api/js?key=AIzaSyC3rthxrJtfGHmGJijI_fMrT96ecSc-AL8&v=3.exp" type="text/javascript"></script><script src="http://cdn.sobekrepository.org/includes/gmaps-markerwithlabel/1.9.1/gmaps-markerwithlabel-1.9.1.js" type="text/javascript"></script></head><body><div id="map"></div><script>function initMap() {var bp = {lat: 47.538736, lng: 19.04631};var map = new google.maps.Map(document.getElementById('map'), {zoom: 11,center: bp});var locations = [['Label 1', 47.453740, 19.142052, 'green', 38, -3],['Label 2', 47.502547, 19.038126, 'red', -10, 20],['Label 3', 47.650821, 19.020171, 'brown', 23, -3],['Label 4', 47.490881, 19.012405, 'yellow', 23, -3],['Label 5', 47.562505, 19.087996, 'red', 23, -3],['Label 6', 47.481118, 19.250704, 'yellow', 37, -3],['Label 7', 47.569537, 19.098241, 'yellow', -10, 20],['Label 8', 47.496817, 19.030732, 'turquoise', 55, 33],['Label 9', 47.480566, 19.276519, 'green', 10, -3],['Label 10', 47.478538, 19.046445, 'turquoise', 23, -3],['Label 11', 47.435689, 19.210308, 'turquoise', 10, -3],['Label 12', 47.492465, 19.052041, 'red', -10, 15],['Label 13', 47.523764, 19.096748, 'green', 25, -3],['Label 14', 47.521279, 19.161779, 'yellow', 25, 50],['Label 15', 47.438614, 19.183433, 'yellow', 45, -5],['Label 16', 47.501973, 19.034013, 'brown', 40, 45]];var icons = {'green': {url: 'https://goo.gl/qvLZ4R',color: '#58D400'},'yellow': {url: 'https://goo.gl/G6HyHS',color: '#FCCA00'},'red': {url: 'https://goo.gl/6hkqX1',color: '#D80027'},'turquoise': {url: 'https://goo.gl/uLRpYZ',color: '#00D9D2'},'brown': {url: 'https://goo.gl/XTosFM',color: '#BF5300'}};var image = 'https://goo.gl/dqvvFA';for (var i = 0; i < locations.length; i++) {var item = locations[i];var marker = new MarkerWithLabel({position: {lat: item[1], lng: item[2]},map: map,icon: icons[item[3]].url,labelContent: item[0],labelAnchor: new google.maps.Point(item[4], item[5]),// the CSS class for the labellabelClass: "label " + item[3],labelInBackground: true});}}initMap();</script></body></html>
Related posts


Since the release of Drupal 8 on November 19, 2015, we have been continuously working on moving clients and their sites from Drupal 7 to the latest version. The migration process has, more often than not, proved to be challenging.

We've decided to rewrite our corporate intranet using a decoupled architecture instead of porting it directly to Drupal 8 as is.